
by Alan Palmer D.C., C.C.S.T.
As I did research on the statistical reporting from an article from the British medical journal Lancet Microbe, I gained some clarity that gave me an ahhh-ha moment and made me furious at the same time. I found this article that explained the fuzzy math techniques that drug companies use to peddle their products to an unsuspecting public and truthfully many doctors who have no clue about how they do this.
Understanding how they do this and what these calculations mean will help you see through the smoke and mirrors on the percentages of efficacy (effectiveness) of the COVID-19 vaccines.
Number Needed to Treat (NNT): A tool to analyze harms and benefits

A key to making an informed medical choice is weighing potential benefits versus potential harms.
But how do you know how likely you are to benefit from a medical treatment or procedure?
One statistic that can help is called the Number Needed to Treat, or NNT.
The NNT tells us the number of people we need to give a drug (or other intervention) to in order for just one person to receive a benefit (or, to prevent just one adverse outcome).
How to calculate NNT
To calculate the NNT, you first have to find out the absolute risk reduction, or ARR. That’s the amount that your risk is reduced by the treatment compared with people who didn’t get it.
The ARR is not a number most people are used to seeing. Studies, news reports, and other media messages are much more likely to focus on a different number, known as the “relative risk reduction,” or RRR, that can be misleading.

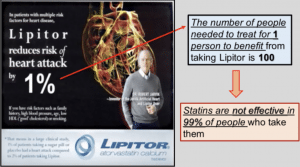
Here’s a classic example: This Pfizer ad makes it look like taking their drug, Lipitor, will reduce your chances of having a heart attack by a whopping 36%. But that’s the relative risk reduction. It tends to exaggerate the benefit. (That’s why you’ll often see relative numbers featured in advertisements.)
This 36% number comes from a randomized trial called ASCOT-LLA published in The Lancet in 2003. It showed that 1.9% of people taking Lipitor suffered a heart attack, while 3.0% of the placebo group had one. The relative risk reduction, or RRR, is the ratio of the two risks and is calculated by subtracting the Lipitor heart attack rate (1.9) from the placebo group rate (3.0) and dividing the difference (1.1) by the placebo group rate (3.0). This equals 36%.
But the absolute risk reduction, or ARR, is calculated by simply subtracting the two risks, so 3.0% – 1.9% = 1.1%.
In reality, Lipitor reduced the risk of heart attack from 3% to about 2%, and this 1% difference is the number that people care about. But the Lipitor ad is more interested in promoting than informing, which is why it describes this difference as a “36%” reduction rather than a more helpful and accurate 1% reduction.
So, let’s calculate the NNT using the ARR of 1%, and see how it reframes the drug’s benefits in a more user-friendly way. The NNT is simply the inverse of the ARR; it can be calculated by taking 100 and dividing it by the ARR (1).
100/ 1 = 100
How NNT helps
This means that 99 people need to take the drug, pay for it, run the risk of side effects, and stand no chance of benefit. Of course, no one knows going in who will be that lucky 1 out of 100 who does benefit.
This is the power of NNT. It gives a sense of scale to discussions regarding potential harms and benefits. In the Lipitor example, if all you read about was the relative risk reduction of 36% highlighted in headlines and advertisements (a likely scenario), your response might be: “Wow! I can cut my risk of a heart attack by over one-third!”
But if you were lucky enough to read some thoughtful news coverage that included the absolute risk reduction of just 1% you might think: “Hmm, that’s a far cry from 36%. I’m going to ask my doctor what she thinks.”
And if you were armed with the NNT number of 100 — realizing you probably won’t be that lucky one person out of 100 who actually benefits from the drug — you might not hesitate to say: “I don’t like those odds at all; especially given the costs and risks.”
It’s important to point out that these decisions are personal, and different people may make different decisions about treatment based on the same information. Furthermore, different people have different baseline risk profiles and different risk tolerance. This means clinical decisions should not be based on NNT alone. It’s just one piece of information that needs to be interpreted in a clinical context and under medical supervision.
Looking at how NNT is calculated it becomes clear that the ideal NNT would be one, because it would mean that all who were treated benefited. But as you might guess, an NNT=1 is rarely, if ever, seen. So what sort of NNT’s are we looking for?
A very helpful 2016 article on NNT by STAT provides some guidance. It quotes a 2006 study from the University of Toronto which offers these guidelines:
An NNT of 5 or less (≤5) was probably associated with a meaningful health benefit … (while) … an NNT of 15 or more (≥15) was quite certain to be associated with, at most, a small net health benefit.
https://www.healthnewsreview.org/toolkit/tips-for-understanding-studies/number-needed-to-treat/
What about the COVID-19 vaccines? For vaccines, the term NNV (Number Needed to Vaccinate) is used. How many people have receive a COVID-19 vaccine in order for one person to benefit?
How effective are the COVID-19 vaccines- REALLY?
I have reported previously on the analysis of the clinical trial data for the Pfizer and Moderna vaccines by Dr. Peter Doshi, an Associate Editor for the British Medical Journal. He found the efficacy to be just a fraction of what the manufacturers reported after their own trials.
Here is just a snippet from that report:
“All attention has focused on the dramatic efficacy results: Pfizer reported 170 PCR confirmed covid-19 cases, split 8 to 162 between vaccine and placebo groups. But these numbers were dwarfed by a category of disease called “suspected covid-19”—those with symptomatic covid-19 that were not PCR confirmed. According to FDA’s report on Pfizer’s vaccine, there were “3410 total cases of suspected, but unconfirmed covid-19 in the overall study population, 1594 occurred in the vaccine group vs. 1816 in the placebo group.
With 20 times more suspected than confirmed cases, this category of disease cannot be ignored simply because there was no positive PCR test result. Indeed this makes it all the more urgent to understand. A rough estimate of vaccine efficacy against developing covid-19 symptoms, with or without a positive PCR test result, would be a relative risk reduction of 19% (see footnote)—far below the 50% effectiveness threshold for authorization set by regulators. Even after removing cases occurring within 7 days of vaccination (409 on Pfizer’s vaccine vs. 287 on placebo), which should include the majority of symptoms due to short-term vaccine reactogenicity, vaccine efficacy remains low: 29%.”
Doshi also had criticisms with the Moderna trial data . . .you can read the full analysis here:
Another reason the reported “effectiveness” of the vaccines is all smoke and mirrors is revealed in a commentary published in the medical journal Lancet Microbe on April 20, 2021. Written by three physicians, the commentary is titled, “COVID-19 vaccine efficacy and effectiveness—the elephant (not) in the room”.
I’m going to reproduce a good portion of the commentary below because of its importance and the profound impact on understanding on the way these things are portrayed.
From the commentary:
Furthermore, excerpts of these results have been widely communicated and debated through press releases and media, sometimes in misleading ways. Although attention has focused on vaccine efficacy and comparing the reduction of the number of symptomatic cases, fully understanding the efficacy and effectiveness of vaccines is less straightforward than it might seem. Depending on how the effect size is expressed, a quite different picture might emerge (figure; appendix).
Vaccine efficacy is generally reported as a relative risk reduction (RRR). It uses the relative risk (RR)—ie, the ratio of attack rates with and without a vaccine—which is expressed as 1–RR. Ranking by reported efficacy gives relative risk reductions of 95% for the Pfizer–BioNTech, 94% for the Moderna–NIH, 90% for the Gamaleya, 67% for the J&J, and 67% for the AstraZeneca–Oxford vaccines. However, RRR should be seen against the background risk of being infected and becoming ill with COVID-19, which varies between populations and over time. Although the RRR considers only participants who could benefit from the vaccine, the absolute risk reduction (ARR), which is the difference between attack rates with and without a vaccine, considers the whole population. ARRs tend to be ignored because they give a much less impressive effect size than RRRs: 1·3% for the AstraZeneca–Oxford, 1·2% for the Moderna–NIH, 1·2% for the J&J, 0·93% for the Gamaleya, and 0·84% for the Pfizer–BioNTech vaccines.
ARR is also used to derive an estimate of vaccine effectiveness, which is the number needed to vaccinate (NNV) to prevent one more case of COVID-19 as 1/ARR.
NNVs bring a different perspective: 76 for the Moderna– NIH, 78 for the AstraZeneca–Oxford, 80 for the Gamaleya, 84 for the J&J, and 117 for the Pfizer–BioNTech vaccines. The explanation lies in the combination of vaccine efficacy and different background risks of COVID-19 across studies: 0·9% for the Pfizer–BioNTech, 1% for the Gamaleya, 1·4% for the Moderna–NIH, 1·8% for the J&J, and 1·9% for the AstraZeneca–Oxford vaccines. ARR (and NNV) are sensitive to background risk— the higher the risk, the higher the effectiveness—as exemplified by the analyses of the J&J’s vaccine on centrally confirmed cases compared with all cases:8 both the numerator and denominator change, RRR does not change (66–67%), but the one-third increase in attack rates in the unvaccinated group (from 1·8% to 2·4%) translates in a one-fourth decrease in NNV (from 84 to 64).
There are many lessons to learn from the way studies are conducted and results are presented. With the use of only RRRs, and omitting ARRs, reporting bias is introduced, which affects the interpretation of vaccine efficacy. When communicating about vaccine efficacy, especially for public health decisions such as choosing the type of vaccines to purchase and deploy, having a full picture of what the data actually show is important, and ensuring comparisons are based on the combined evidence that puts vaccine trial results in context and not just looking at one summary measure, is also important. Such decisions should be properly informed by detailed understanding of study results, requiring access to full datasets and independent scrutiny and analyses.
Unfortunately, comparing vaccines on the basis of currently available trial (interim) data is made even more difficult by disparate study protocols, including primary endpoints (such as what is considered a COVID-19 case, and when is this assessed), types of placebo, study populations, background risks of COVID-19 during the study, duration of exposure, and different definitions of populations for analyses both within and between studies, as well as definitions of endpoints and statistical methods for efficacy. Importantly, we are left with the unanswered question as to whether a vaccine with a given efficacy in the study population will have the same efficacy in another population with different levels of background risk of COVID-19. This is not a trivial question because transmission intensity varies between countries, affected by factors such as public health interventions and virus variants. The only reported indication of vaccine effectiveness is the Israeli mass vaccination campaign using the Pfizer–BioNTech product. Although the design and methodology are radically different from the randomised trial, Dagan and colleagues report an RRR of 94%, which is essentially the same as the RRR of the phase 3 trial (95%) but with an ARR of 0·46%, which translates into an NNV of 217 (when the ARR was 0·84% and the NNV was 119 in the phase 3 trial). This means in a real-life setting, 1·8 times more subjects might need to be vaccinated to prevent one more case of COVID-19 than predicted in the corresponding clinical trial.
Uncoordinated phase 3 trials do not satisfy public health requirements; platform trials designed to address public health relevant questions with a common protocol will allow decisions to be made, informed by common criteria and uniform assessment. These considerations on efficacy and effectiveness are based on studies measuring prevention of mild to moderate COVID-19 infection; they were not designed to conclude on prevention of hospitalisation, severe disease, or death, or on prevention of infection and transmission potential. Assessing the suitability of vaccines must consider all indicators, and involve safety, deployability, availability, and costs. (bold emphasis added)
https://www.thelancet.com/journals/lanmic/article/PIIS2666-5247(21)00069-0/fulltext
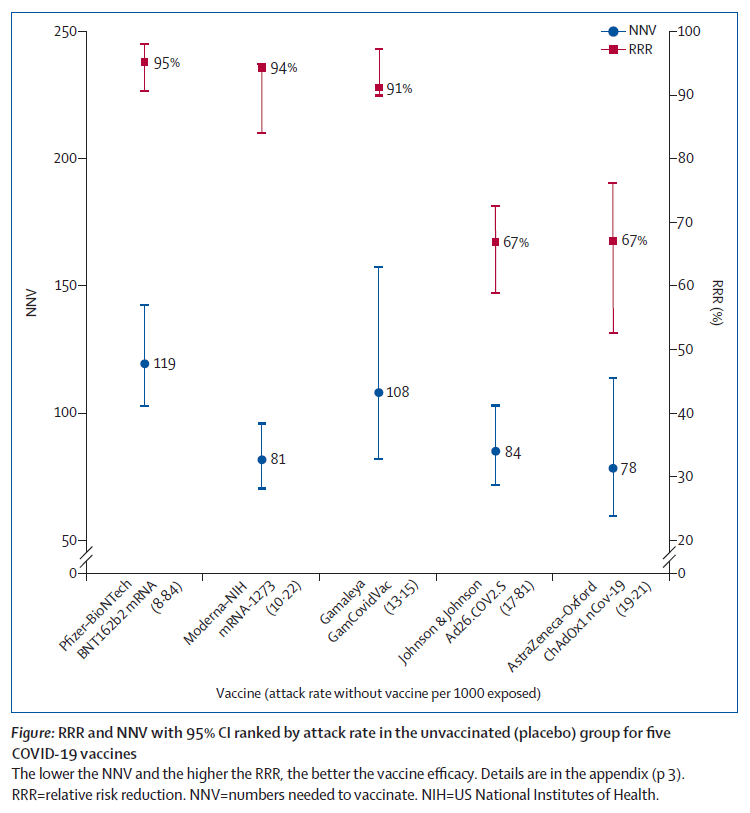
So, looking at the chart above, the Number Needed to Vaccinate (NNV) for one person to benefit from the vaccine is the following for the different vaccines:
Pfizer: 119 (although when calculated real-world in the entire Israeli population as cited above the NNV is 217)
Moderna: 81
Gamaleya: 108
J & J: 84
Astra Zeneca: 78
These are the results based on clinical trial data, which as stated above doesn’t consider the entire population.
When you hear people like Dr. Fauci saying the effectiveness of the Pfizer vaccine is 95%, the public assumes he knows what he is talking about. But does he? Is he knowingly parroting Pfizer’s talking point sales pitch? Is he ignorant about the statistical reporting bias and misleading information he is telling the world? Is he a useful idiot or a complicit liar? These are serious questions. Because if he is ignorant about how things should be reported, he has no business being in the job he is in at the NIAID, or as the “trusted” spokesperson for the media and to the public. If he is not ignorant about how to truthfully report study results, then he is nothing more than a drug rep and has no business in the position he is in as the “trusted” spokesperson for the media and to the public. Either way, we need someone else who can tell the public the truth in that capacity.
There also may be some inherent challenges with just reporting NNT to the public. A decision as to which patient may want to assume the risk of the medication based on being that one person in X number of people who may benefit should always be between a doctor, their patient and the patient’s ability to do their own research. It may boil down to their genetic and clinical risk factors. But isn’t that the exact same argument for the vaccines? The decision should be up to each individual based on providing them with ALL the information and in consultation with their doctors looking at all the risk vs. benefits making a calculated decision. True science. True medical care. True informed consent. And a process of true critical thinking.